
The evolution of urban spatial structure in Sub-Saharan African cities, 2004–2024
How is the internal structure of African cities changing as they grow? The region is urbanizing faster than any other, yet most of what is known about where centers form, and how far people live from them, comes from data-rich settings elsewhere. This project builds a consistent twenty-one-year panel for the region and asks what actually happened between 2004 and 2024.
The unit of observation is the Africapolis 2020 built-up footprint of each agglomeration; 482 cities survive the selection rules. For every city and year we identify population centers from gridded population data, then measure three things: how many centers a city has, how balanced its two leading centers are (CP), and what share of the population lives outside the centers (DISP). Crossing polycentricity with dispersion gives a four-type typology of urban structure, and the same city can be followed through it year by year.
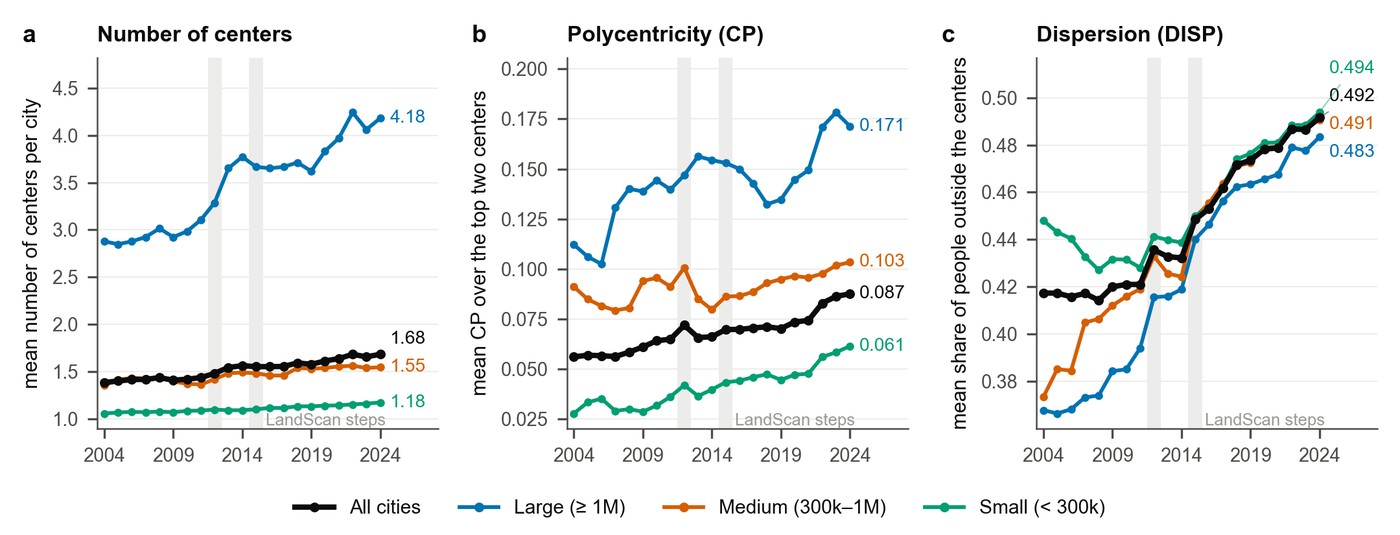
Most cities of the region are still monocentric, but subcenters are emerging. The share of cities with at least two centers rises from 16% to 27%, and the mean number of centers per city from 1.39 to 1.68. Large cities gain centers fastest, from 2.9 to 4.2 per city, and change their structure most often. Polycentricity rises only modestly — mean CP from 0.056 to 0.088 — and it rises through new subcenters rather than through a rebalancing of the centers a city already had.
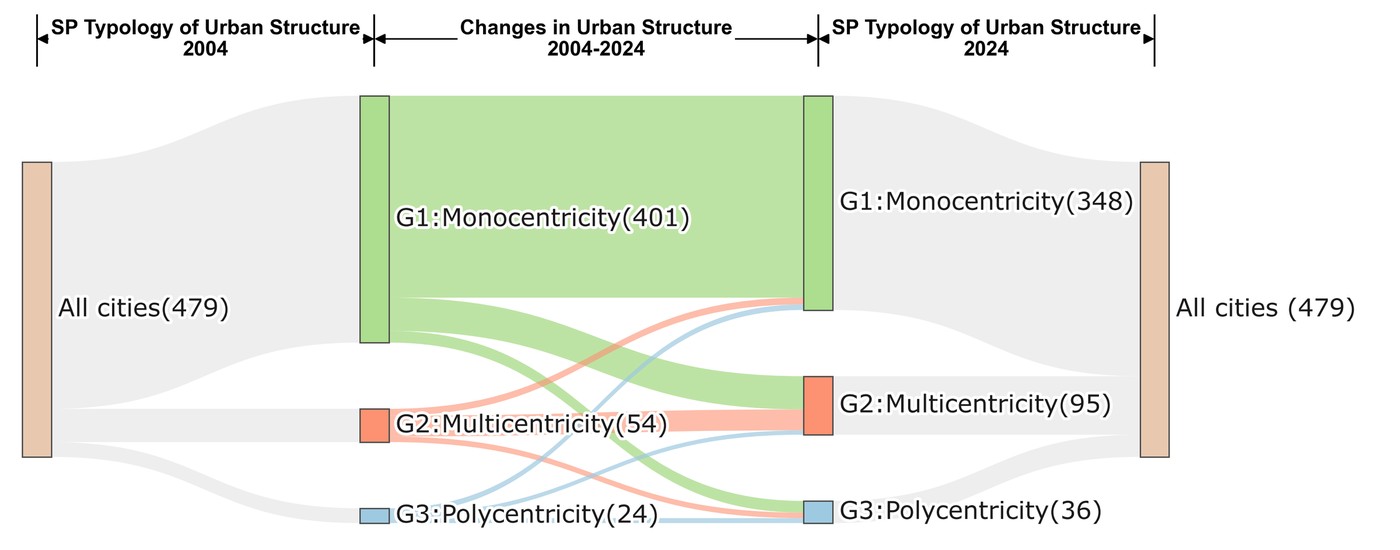
Dispersion, meanwhile, rises in every size class: mean DISP from 0.42 to 0.49. The monocentric group shrinks from 401 to 348 cities (84% to 73%), the multicentric group grows from 54 to 95, and the polycentric group from 24 to 36. Read through the four-type typology, monocentric–compact cities fall from 62% to 48%, while monocentric–dispersed rise from 30% to 37% and polycentric–dispersed from 5% to 12%.
The overall picture is dispersal with some subcentering — and it runs opposite to what has been found for Chinese cities over a comparable period, where a growing share of the population came to live in compact centers. The directions are robust to the rule used to identify centers: alternative rules differ in levels but agree on every direction of change.